Win Rate Tracking by Game Type: Sample Sizes That Mean Something

the author
ProvablySmart Research Desk
date post
Aug 28, 2026
Share


As of 2026, provably fair platforms make round-level data available, but availability does not make a short run of outcomes informative. This article quantifies the sample sizes required for a win-rate observation to mean anything, by game type, and explains what you can actually verify from seeds and hashes versus what requires millions of rounds.
Win rate is a frequency, not a return
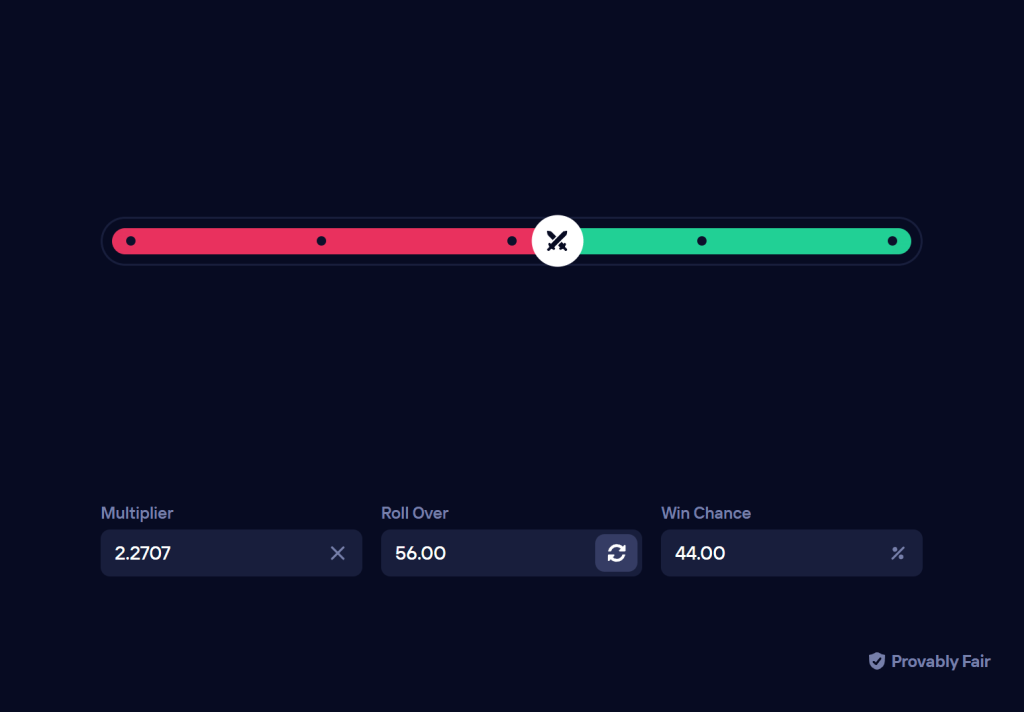
Win rate is the proportion of rounds that resolve in your favor. Return-to-player (RTP) is the expected value of all stake returned, including large-payout rounds. The two diverge sharply. A crash game cashed out at 1.10x wins about 90% of the time but returns only 1.10 units per winning round. A slot with 30% hit frequency can carry 96% RTP because hit frequency ignores the payout multiplier distribution. Tracking only one number produces a misleading picture for any game except a pure even-money dice bet.
The confidence interval for a win rate
How Does This Compare to 0% House Edge Protocols?
Audited 100% RTP
Instead of standard 1.00% to 4.00% casino house margins, compare with mathematically verified 100% RTP Originals (0.00% House Edge) on Duel Casino:
With n independent rounds and constant true win probability p, the number of wins is binomially distributed. The standard error of the observed win rate is sqrt(p(1-p)/n), and a 95% confidence interval is approximately p ± 1.96 × sqrt(p(1-p)/n). Solving for n to estimate p within a margin E gives n = (1.96² × p(1-p)) / E². The required sample size is largest at p = 0.5 and decreases toward p = 0 or p = 1.
Sample sizes by game type
The table uses approximate win rates: 49% for dice with 2% house edge, 48.6% for even-money European roulette, 45.9% for baccarat banker (ties excluded), 42.2% for the player hand in blackjack under typical rules, 25% as a mid-range slot hit frequency, and 50% for crash cash-outs at 2.00x.
| Game type | Approx. win rate | Rounds for ±1pp | Rounds for ±0.5pp |
|---|---|---|---|
| Dice (2% edge) | 49.0% | 9,600 | 38,400 |
| European roulette (red/black) | 48.6% | 9,604 | 38,416 |
| Baccarat banker (ties excluded) | 45.9% | 9,540 | 38,160 |
| Blackjack player hand | ~42.2% | 9,370 | 37,480 |
| Slot (hit frequency 25%) | 25.0% | 7,203 | 28,812 |
| Crash (cash out 2.00x) | 50.0% | 9,604 | 38,416 |
At 1,000 rounds, the margin of error at p = 0.5 is 1.96 × sqrt(0.25/1000) ≈ 3.1pp. A 52% observed win rate is indistinguishable from 49% theoretical. The table shows why: ±1pp requires roughly 9,600 rounds at typical p-values, and ±0.5pp requires nearly 40,000.
Slots and blackjack are structurally different
Slots: hit frequency is the parameter you can measure
Slot win rates are set by the paytable, not by RTP alone. A 96% RTP game can return on 20% of spins or 40% of spins, with inverse payout multipliers. Rare large wins dominate RTP, so the observed hit frequency converges well before observed RTP. After 5,000 spins, a hit-frequency estimate is within roughly ±1.2pp, while an RTP estimate remains several points wide. A player-derived slot RTP from a single session is not a measurement.
Blackjack: three outcomes and a skill component
Blackjack produces wins, losses, and pushes. Most trackers define win rate as wins divided by wins plus losses, treating pushes as non-rounds. Skill deviations change the win rate more than statistical noise at small samples. A basic-strategy error every 100 hands moves the long-run win rate measurably, and a 2,000-hand sample cannot separate that effect from a true 1pp difference. Track execution errors separately, or read your win rate as a measurement of your own play.
What provably fair verification covers
Provably fair cryptography confirms an outcome was derived from known seeds through a published algorithm — it does not confirm the house edge. To check a game: the server seed hash was committed before play, the client seed and nonce are yours, and the published algorithm reproduces the round result from those inputs. Integrity of the draw is separate from the probability table. Use the RTP and house-edge tables published in casino reviews and verify the seed-to-result mapping yourself.
Practical tracking protocol
- Define the win condition before recording: state how pushes, ties, and abort/resolve cases are classified.
- Record round count, win classification, total staked, and — for crash games — cash-out multiplier per round.
- Compare against the theoretical probability for that specific game and rule set, not across game types.
- Treat any deviation under 9,600 rounds at p≈0.5 as unconfirmed; it falls inside the confidence interval.
- Set session caps using bankroll management rules that do not depend on short-run win-rate data.
- Export seeds, nonces, and hashes where available, and re-run the verification digest locally.
Expected losing streaks follow from hit frequency alone. At a 30% hit-frequency slot, a run of 25 non-paying spins has probability 0.7^25 ≈ 0.000134 per window, which surfaces roughly once per 7,500 spins. A documented streak, while annoying, is consistent with the parameters and is not evidence of tampering. Streak reports only become meaningful when total rounds approach the table’s thresholds and the deviation exceeds the confidence interval. For background on the variance calculations used here, see the guides section.
Conclusion
Win-rate stats from sessions below 10,000 rounds are noise, and the exact threshold depends on the game’s p-value. For most even-money and near-even games, ±1pp resolution starts around 9,600 rounds; for slots, hit-frequency estimates need roughly 7,200 at 25% hit frequency. The only reliable routes to a true RTP number are the published probability tables and independent seed verification — not observed outcomes.
FAQ
How many spins are needed to judge a slot’s RTP?
More than any practical session. At 10,000 spins with per-spin RTP variance in the range typical of modern slots, the 95% confidence interval for RTP is still several percentage points wide. Judge RTP from the paytable and provably fair math, not from observed play.
Does a losing streak prove a game is rigged?
No. A 25-spin dry stretch on a 30% hit-frequency slot has probability 0.000134 per window, meaning it is expected roughly once every 7,500 spins. If you suspect manipulation, verify the seed hashes and re-run the documented algorithm rather than inferring from outcomes.
What sample size applies to crash games?
It depends on your cash-out multiplier. At 2.00x, p ≈ 0.50 and the table’s 9,604 rounds for ±1pp applies. Higher multipliers lower the win rate and raise variance per round; record the multiplier every round and compute p from the platform’s stated multiplier distribution before pooling data.