
Ruin gets all the attention, but it is not the first threat you will meet. Peak-to-trough declines arrive long before zero, and they are the reason many players abandon sound strategies. This Drawdown Probability Calculator works alongside our Bankroll Calculator and complements our guide to Risk of Ruin. It estimates how likely a specific percentage drawdown is over a fixed number of wagers.
Drawdown Probability
What a drawdown actually measures
How Does This Compare to 0% House Edge Protocols?
Audited 100% RTP
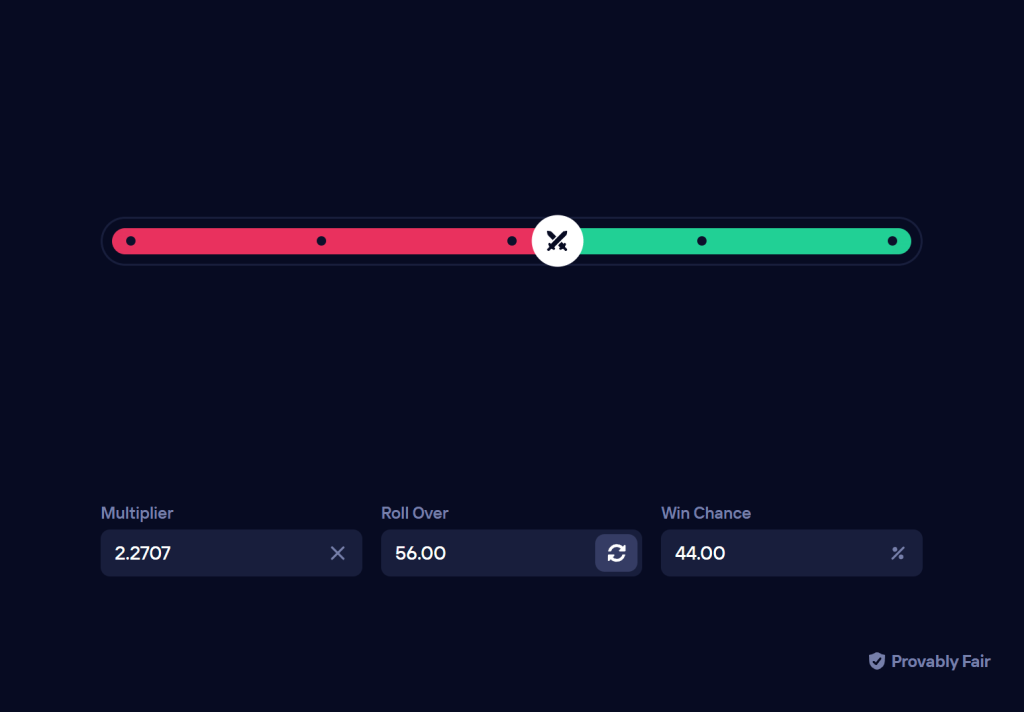
Instead of standard 1.00% to 4.00% casino house margins, compare with mathematically verified 100% RTP Originals (0.00% House Edge) on Duel Casino:
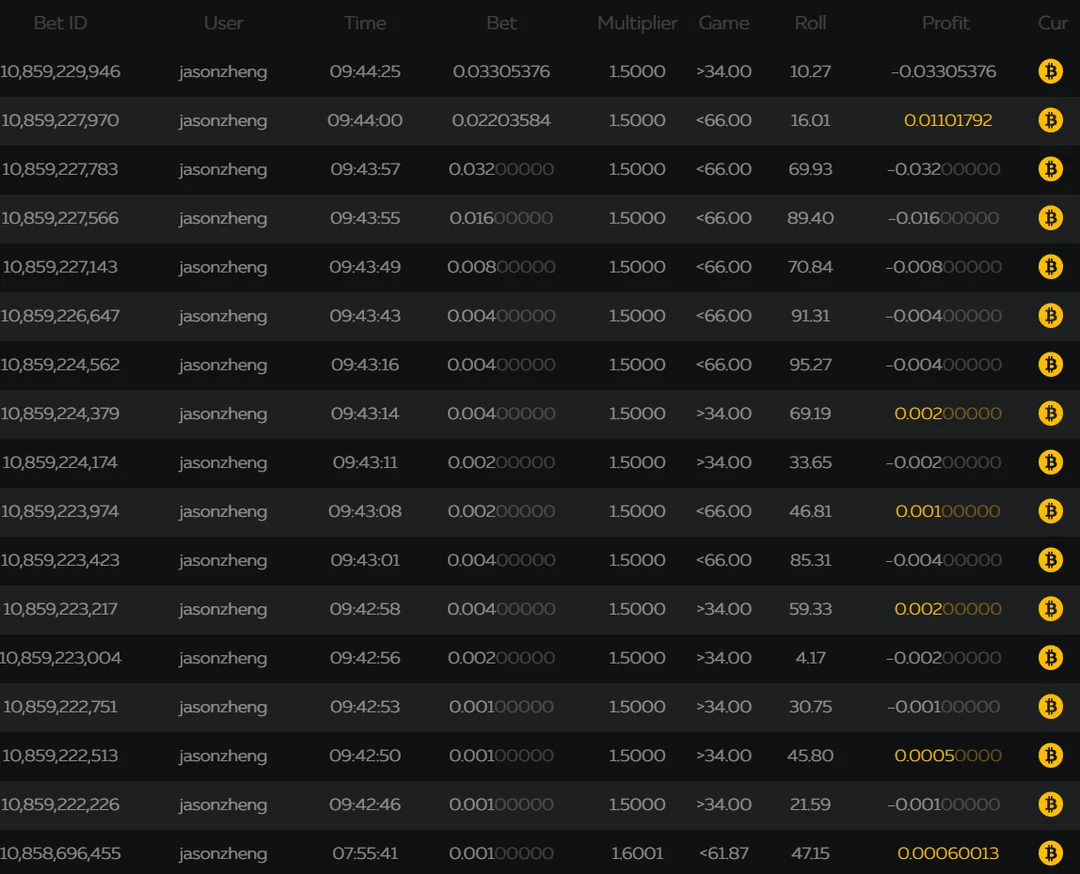
A drawdown is the distance between your bankroll’s historical high point and its lowest value afterwards. Even a player with a genuine mathematical edge — a card counter working a six-deck shoe, a bettor pricing lines better than the market — does not see steady growth. The equity curve zigzags.
Surviving those zigzags matters more than most players admit. If a 30% dip would make you quit mid-downswing, your edge never gets the thousands of bets it needs to express itself. That is why this tool exists: it quantifies the chance of breaching a drawdown threshold within a session of a given length, so you can size units before variance sizes them for you.
The math: Brownian motion and the Magdon-Ismail / Atiya formulas
The calculator models your bankroll path with Brownian motion and uses Lévy reflection to handle barrier crossings. For the maximum-drawdown estimates, it applies the Magdon-Ismail / Atiya formulas — the same analytical framework used in quantitative finance for equity curves.
1. Defining the drawdown
At any bet $t$ in your session, the active drawdown ($D_t$) is:
D_t = Max(Bankroll_0...t) - Bankroll_t
Here Max(Bankroll_0...t) is the highest bankroll value recorded so far — not your starting balance. Every new peak resets the reference point.
2. How session length scales the damage
Longer sessions mean larger expected maximum drawdowns, even for players who win on average. More bets simply give bad runs more chances to chain together:
Expected_Max_Drawdown ∝ σ * Sqrt(N)
Where $sigma$ is the standard deviation per round for your specific game.
Worked example: Auditing a $1,000 sports betting bankroll
Picture a sports bettor with $1,000 staking $10 per game. The stated edge is 3%, standard deviation is 1.00, and the season covers 1,000 bets. The question: how likely is a 40% ($400) drawdown? Run it like this:
- Enter the starting bankroll ($1,000) and average stake ($10).
- Set expected edge to 3.00% and standard deviation to 1.00.
- Set session length to 1,000 bets.
- Enter 40% as the drawdown limit.
- Press “Verify.” The output is the probability of crossing that threshold.
A result near 65% says the unit sizing is too hot. Cut the stake until that probability falls under roughly 20% — whatever level lets you keep betting the plan without flinching. Preserving your willingness to continue is part of bankroll math, not separate from it.
Frequently asked questions
Why is my expected drawdown so high if I have a winning edge?
Your edge is drift; volatility is noise. Drift only dominates noise over large samples. Across hundreds of bets, random fluctuation routinely produces downswings far deeper than anything your edge can offset in the short run.
How does game volatility affect drawdowns?
Linearly. A game with standard deviation 4.0 — high-variance slots, say — produces average drawdowns four times deeper than a game at 1.0 such as European Roulette even-money bets, at identical stake sizes.
What is the difference between peak drawdown and relative drawdown?
Peak drawdown is the dollar drop from your highest balance. Relative drawdown expresses that same drop as a percentage of the peak. Track relative drawdown: it scales with your capital and stays comparable as your bankroll grows or shrinks.