
Losing streak makes a player cry “rigged.” A winning session convinces them they found an edge. Neither reaction tells you anything. This RNG Audit Calculator replaces gut feeling with two independent statistical tests that check whether a casino’s seed stream behaves like genuine randomness — an essential step before trusting any provably fair game is actually safe.
RNG Audit — Chi-square + Runs Test
Why one statistical test is not enough
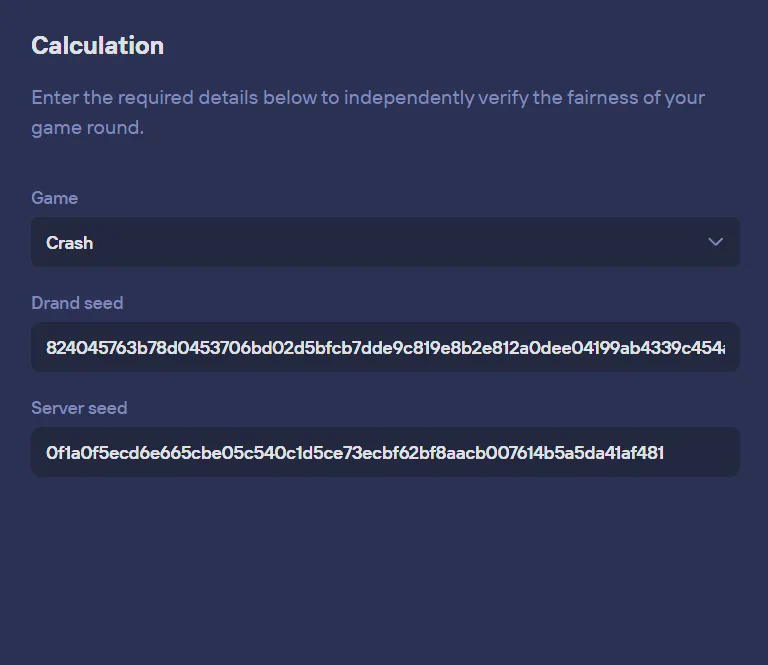
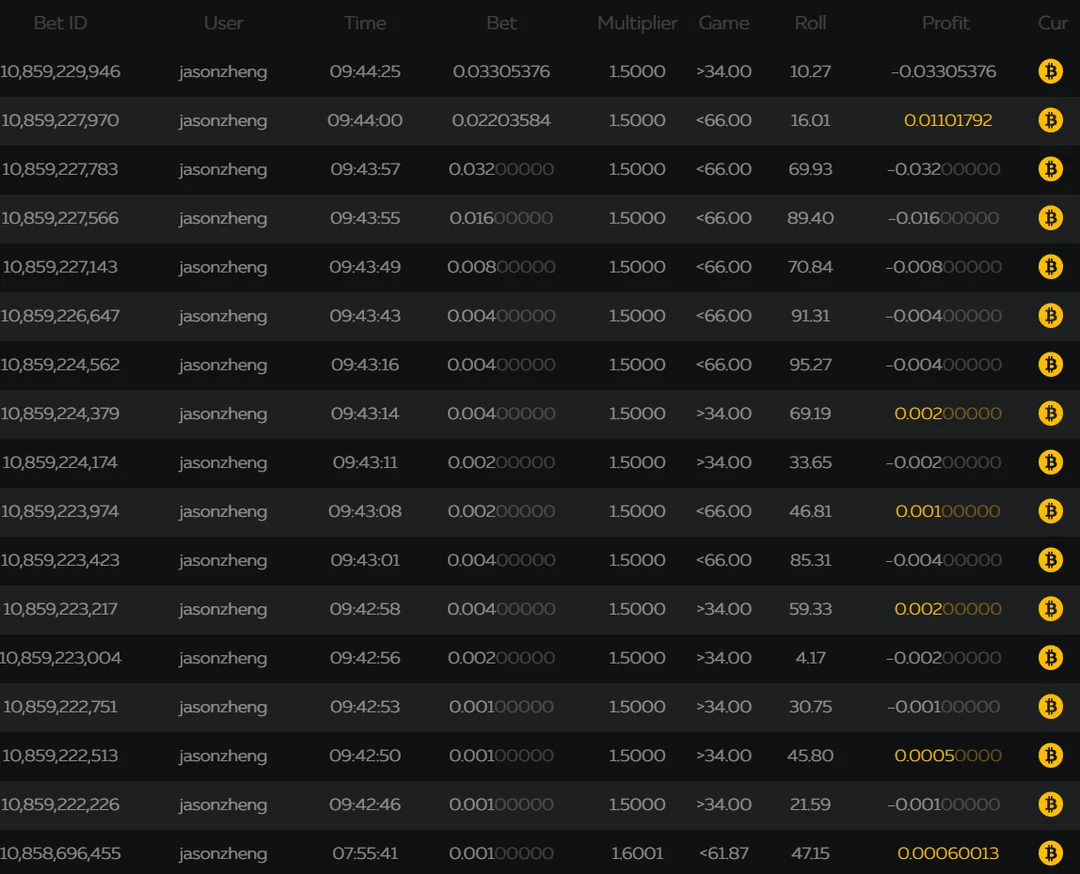
A dishonest operator doesn’t need obviously skewed outcomes to cheat. Suppose the game holds its advertised 97% RTP across thousands of rounds — it would pass most compliance checks. The manipulation can hide in the *ordering*: winning rounds grouped while your bets are small, losing rounds grouped the moment you raise your stake.
Real randomness must clear two separate hurdles: statistical uniformity (values spread evenly) and serial independence (no memory, no predictable patterns). One test alone only measures half of that.
The two pillars of RNG auditing
Paste your recorded sequence of floating-point values or dice results into the verifier and it runs both tests on the same sample:
1. Chi-Square Goodness-of-Fit Test (Uniformity)
The Chi-Square test checks if the outcomes are spread evenly across all possible bins. For example, if you roll a 6-sided die 6,000 times, each face should appear approximately 1,000 times:
χ² = Σ ((Observed_i - Expected_i)^2 / Expected_i)
Where Observed is the actual count in bin i, and Expected is the theoretical count. The calculator converts this χ² statistic into a precise p-value using the Wilson-Hilferty approximation.
2. Wald-Wolfowitz Runs Test (Independence) (best paired with the Kolmogorov-Smirnov Test)
Uniform distributions can still hide structure. Take [1, 6, 1, 6, 1, 6...]: every face shows up equally often, yet nobody would call that random. The Runs Test counts continuous stretches of values above and below the median (“runs”) and compares them against what chance predicts:
Expected_Runs (μ) = ((2 * N1 * N2) / N) + 1
Standard_Deviation (σ) = √((2*N1*N2 * (2*N1*N2 - N)) / (N^2 * (N - 1)))
Here N1 counts values above the median, N2 those below, and N the total sample size. From these figures the calculator derives the standard normal Z-score:
Z = (Observed_Runs - μ) / σ
A large absolute Z-score is the red flag. Too few runs means clustering; too many means someone smoothed the stream into artificial alternation.
Data Sandwich: Auditing 500 crash rounds
Here’s how an audit looks in practice. Pull 500 consecutive crash multipliers from a casino’s history feed, convert them back to raw floating-point seeds in the 0–1 range, and paste them in:
- Chi-Square P-Value: 0.42 (Uniformity check: **PASSED**)
- Runs Test Z-Score: -3.85 (P-value: 0.0001, Independence check: **FAILED**)
On paper, half the audit looks clean: decimals are evenly represented across the full 0–1 range. Then comes Z = -3.85, far outside the expected range. The sample contains significantly fewer runs than probability predicts — wins and losses sit in blocks instead of mixing freely. That combination of uniform values and ordered sequences points squarely at a manipulated RNG.
Frequently asked questions
What does a failed Runs Test mean?
Failure means outcomes depend on each other — the sequence carries memory. Streaks that cluster too tightly, or alternations so regular you could bet on them, indicate the RNG ordering has been tampered with.
How many inputs do I need for a reliable audit?
Statistical validity starts at roughly 100 consecutive outcomes. For high-confidence conclusions, paste 500 or more; larger samples sharply reduce false alarms from ordinary variance.
Can an RNG pass both tests but still be rigged?
In theory yes — a sufficiently sophisticated cheat could evade any single test. In practice, real-time outcome steering based on bet size almost always trips the Wald-Wolfowitz Runs Test over a large sample. A clean pass across hundreds of rounds remains the strongest available evidence of fair play.