
Play a negative expected value game long enough and going broke stops being a question of “if” — only “when” (our guide to the mathematics of Risk of Ruin explains why this boundary is absorbing). This Time to Ruin Calculator runs Monte Carlo simulation to estimate your survival lifespan, reporting the median and the spread of hours your bankroll will hold up (use our general Bankroll Calculator to check your starting unit bounds).
Time to Ruin — Distribution
The “when” instead of the “if”
How Does This Compare to 0% House Edge Protocols?
Audited 100% RTP
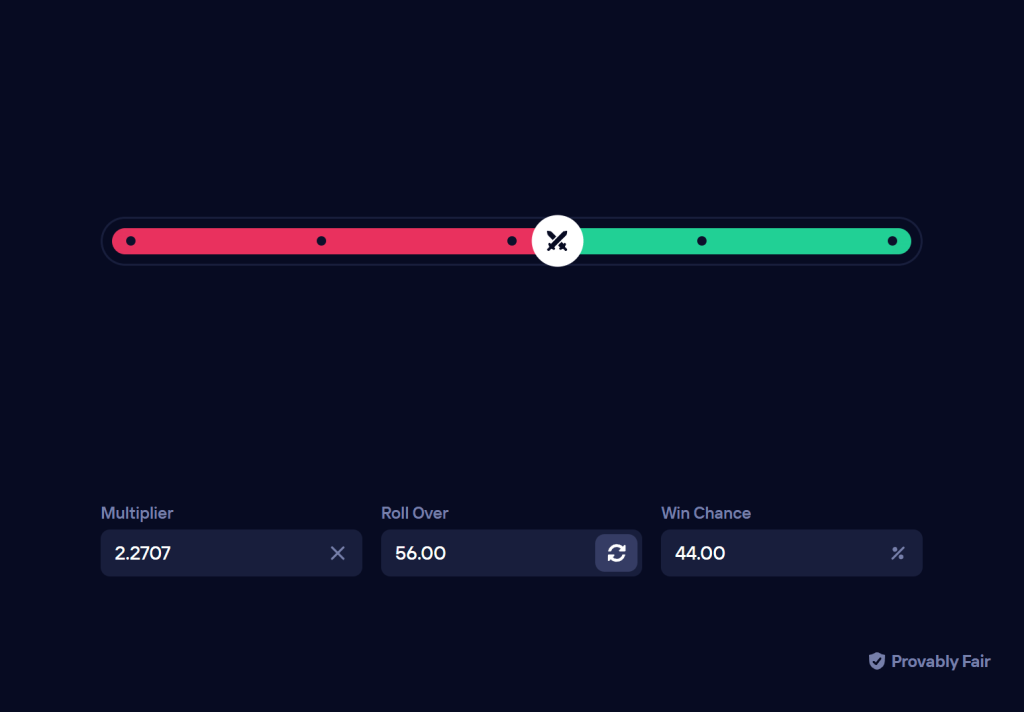
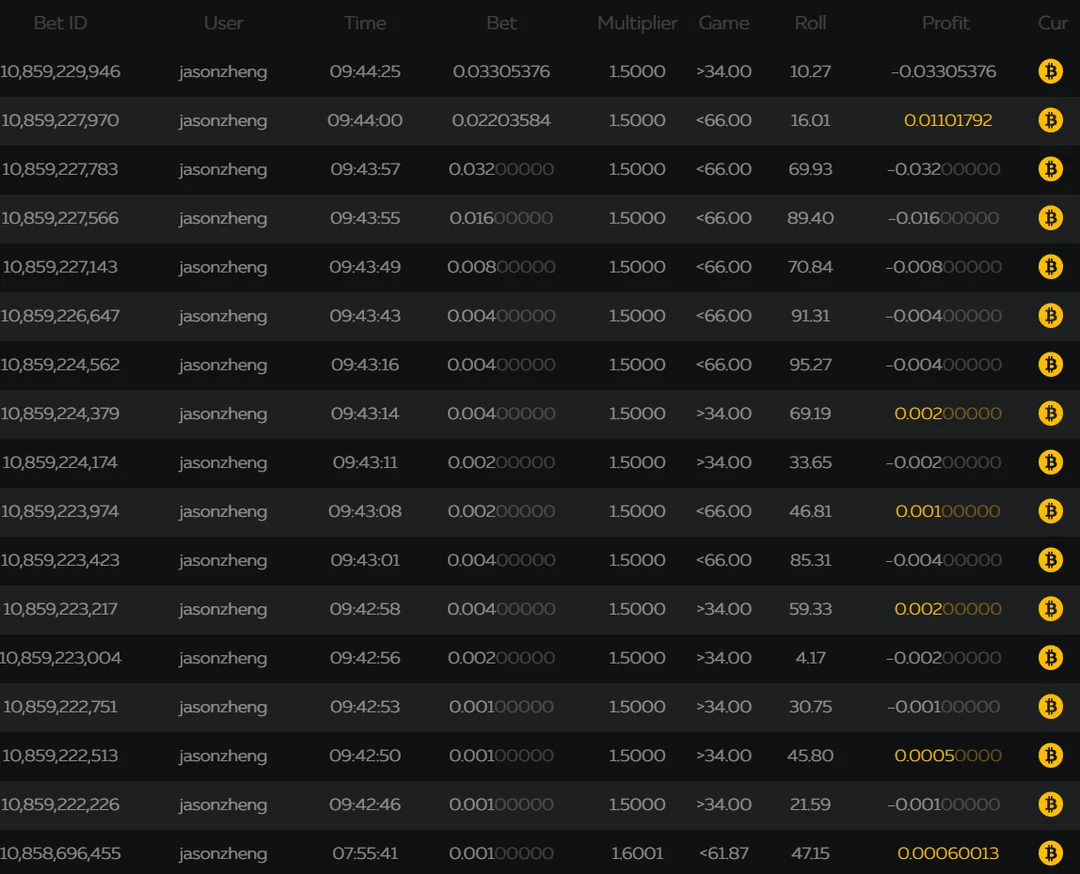
Instead of standard 1.00% to 4.00% casino house margins, compare with mathematically verified 100% RTP Originals (0.00% House Edge) on Duel Casino:

Classic risk models give you Risk of Ruin — the total probability that you eventually hit zero. Useful, but incomplete for a recreational player. Suppose the number is 100%. That tells you nothing about pacing. The real question becomes: **how much playing time can I extract before the money runs out?**
This tool treats your bankroll as a random walk with an absorbing barrier at zero and simulates thousands of sessions to build the full probability distribution of survival time. The output maps how many hands, spins, or clock hours your capital can realistically fund before hitting zero.
How survival time distributions are computed
Bankroll outcomes are path-dependent: two players with identical stakes can see wildly different ruin times. No simple closed-form solution covers that. So this tool relies on a Monte Carlo engine that pushes each simulated bankroll until it dies:
1. Tracking the path
Each run starts at $B$ (your starting bankroll) and accumulates random results until the balance crosses zero:
Bankroll_t = Bankroll_{t-1} + Outcome_t
Stop when Bankroll_t ≤ 0
The step count where the walk terminates is logged as that run’s “Time to Ruin” ($T_{ruin}$).
2. Analyzing the distribution
Survival times pile up in a heavily right-skewed distribution. Most simulations die fast; a lucky handful ride hot streaks for tens of thousands of rounds and drag the mean upward with them. To keep the picture honest, we report:
- Median Survival Time (P50): The point where exactly half of all sessions have already ended in ruin. Treat this as your realistic baseline.
- Interquartile Range (IQR): The band between the 25th percentile (fast, unlucky ruin) and the 75th percentile (extended, lucky play).
Data Sandwich: $500 on Slots vs. Blackjack
Take a $500 starting bankroll, $5 per round, played at 200 rounds per hour:
Game A: High-Volatility Slot (4.00% Edge, 4.0 SD)
- Expected Median Survival: ~2.5 hours
- 25th Percentile: 45 minutes (ruined extremely fast due to bad variance)
- 75th Percentile: ~6 hours (lucky jackpot extensions)
Game B: Blackjack Basic Strategy (0.50% Edge, 1.15 SD)
- Expected Median Survival: ~24 hours
- 25th Percentile: ~12 hours
- 75th Percentile: ~48 hours
Same bankroll, same stake size — nearly tenfold difference in median life. On the slot there’s a serious chance you’re broke inside the first hour; blackjack’s combination of a thin 0.50% edge and low volatility buys you multiple separate sessions almost by default.
Frequently asked questions
Why is the median survival time more accurate than the mean?
Right-tail skew. A few simulations catch enormous winning streaks and survive millions of rounds, inflating the mean well above what any typical experience looks like. The median sits at the true center of the distribution and won’t be dragged around by outliers.
How can I extend my median time to ruin?
Four levers: pick games with a lower house edge, shrink your bet relative to bankroll, reduce rounds per hour, or favor low-volatility games so sudden drawdowns don’t end the session prematurely.
What does an “absorbing zero” mean?
An absorbing barrier is a state the process can enter but never leave. Zero bankroll is the gambling version: once you’re there, no further wagers are possible and the session ends permanently.