Dice Verification: Running the 10,000-Roll Distribution Test Yourself

the author
ProvablySmart Research Desk
date post
Aug 28, 2026

Share


Provably fair dice is one of the few casino games where every bet can be audited after the fact. The math is simple: a server seed, a client seed, and a nonce are hashed, then the hash is converted into a number between 1 and 10,000 or 0 and 99.99. But passing the fairness check for individual rolls is only half the verification. The other half is confirming that the aggregated results actually follow the uniform distribution you contractually expect. This article explains how to run a 10,000-roll distribution test yourself, using nothing more than the bet history, a spreadsheet, and a few standard statistical tools.
What a Fair Dice Game Should Look Like
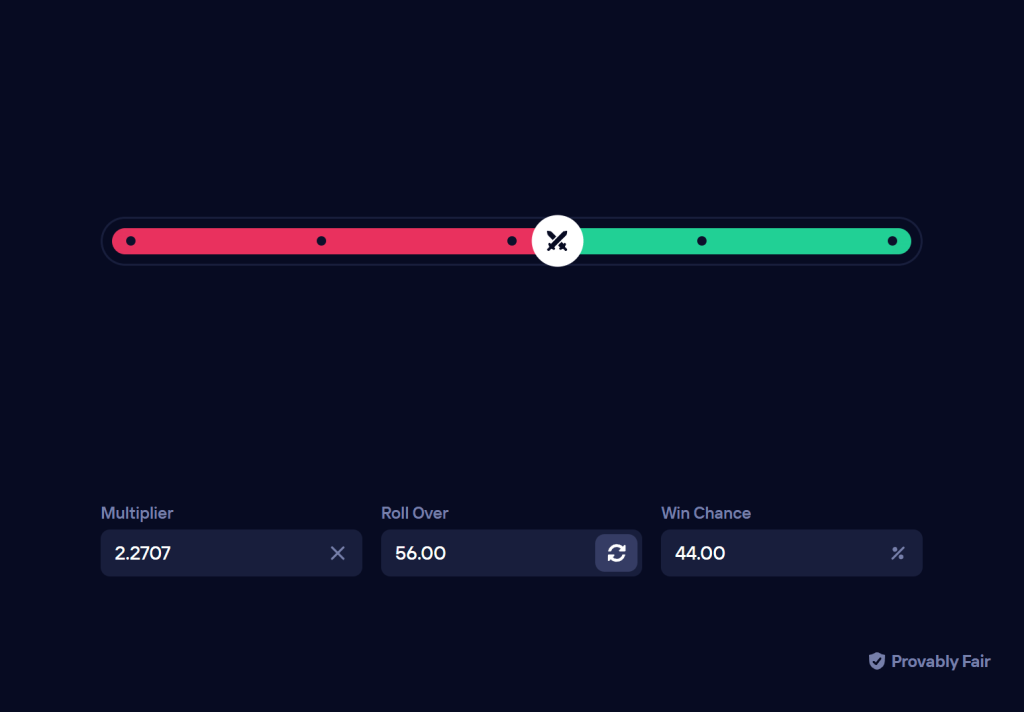
A regulated or provably fair dice game uses a random source that, over a long sequence, produces each possible outcome with equal probability. For a standard 10,000-roll sample, the expected frequency per outcome is exactly one, if the game operates on a 1 to 10,000 scale. If the game uses a percentage scale with two decimal places, you will have 10,000 possible values from 0.00 to 99.99, and each should appear once on average.
That is the theoretical baseline. Real randomness does not give you exactly one occurrence per value in any finite sample. Instead, you expect a Poisson distribution around that mean. A value is slightly more likely to appear twice than once, and some values will appear three or more times. The key question is whether the observed counts are within the range of plausible random variation. If they cluster too tightly, or too loosely, you have evidence something is off.
Gathering the Roll Data
How Does This Compare to 0% House Edge Protocols?
Audited 100% RTP
Instead of standard 1.00% to 4.00% casino house margins, compare with mathematically verified 100% RTP Originals (0.00% House Edge) on Duel Casino:

Most crypto casinos export bet history as CSV or JSON, either through the interface or through an API. You need a continuous series of 10,000 rolls from the same game, under the same rules, with the same target configuration if you are testing a specific win chance. If you change win chance mid-series, the distribution of outcomes changes. Stick to a single constant configuration.
- Collect the roll result for each bet. For a multiplication-based dice game, the outcome field is typically the roll number that the game settled on.
- Record the server seed, client seed, and nonce for each roll. You will need these if you want to independently re-verify a suspicious subset.
- If the casino provides a
hashed_server_seedbefore the round begins, verify that the revealed seed matches the hash. That is your first layer of verification. - Sort the data chronologically by nonce, not by date, because API exports sometimes reorder entries.
For more on seed verification procedures, see our provably fair guides. The distribution test assumes the individual rolls are already authentic. If the seeds or hashes fail, do not proceed to the distribution test.
Building the Frequency Table
Once you have 10,000 roll outcomes, count how many times each of the 10,000 possible values appeared. You can do this in Python, R, or even a spreadsheet with a pivot table. The result is a table of observed counts O_i for each value i = 1 ... 10,000.
If you are using Python, the following one-liner is enough after loading a list of roll results:
from collections import Counter
counts = Counter(rolls)
For a 10,000-roll sample, the sum of all counts must equal 10,000. Check that first. If the total is off by one or more, you either have a duplicate bet or a missing roll. Discard the set and re-export.
Expected Frequencies
For each value, the expected count E_i is the sample size divided by the number of possible outcomes. With 10,000 rolls and 10,000 distinct values, E_i = 1 for every value. This is a special case. In most distribution tests, the expected frequency is larger than one, but dice with a 1/10,000 resolution forces you to work with very small expected counts.
The Poisson distribution with lambda equal to 1 gives the theoretical probability of observing k occurrences of a single value in 10,000 rolls:
| Occurrences (k) | Probability | Expected values in 10,000-set |
|---|---|---|
| 0 | 36.7879% | 3678.8 |
| 1 | 36.7879% | 3678.8 |
| 2 | 18.3940% | 1839.4 |
| 3 | 6.1313% | 613.1 |
| 4 | 1.5328% | 153.3 |
| 5+ | 0.3661% | 36.6 |
You can compare your observed frequency of zero-occurrence values, one-occurrence values, and so on to these expected numbers. This simple check is more sensitive than a full chi-square test in some cases because it captures the overall shape of the distribution.
The Chi-Square Goodness-of-Fit Test
The standard tool for distribution verification is Pearson’s chi-square test. In our case, the test statistic is:
X² = Σ (O_i - E_i)² / E_i
where the sum runs over all 10,000 values. Because E_i = 1, the formula simplifies to:
X² = Σ (O_i - 1)²
That is just the squared deviation from one, summed over all outcomes. If you have a Python Counter, you can compute it as:
chi2 = sum((cnt - 1)**2 for cnt in counts.values())
For a uniform distribution, this statistic follows a chi-square distribution with 10,000 - 1 = 9,999 degrees of freedom. The expected value of a chi-square statistic is roughly equal to its degrees of freedom, so around 10,000. The variance is twice the degrees of freedom, so a standard deviation of about 141.
- If
X²is below 9,600, the sequence looks too uniform. This can be intentional, but it also indicates a possible bug where the same pseudo-random cycle is repeating or the generator is not actually random. - If
X²is above 10,400, the sequence has too many repeats or too many missing values. Some deviation is normal, but values beyond 10,700 or below 9,300 are unlikely under the null hypothesis. - For a formal p-value, use a chi-square survival function from your statistics library. For example, in Python:
from scipy.stats import chi2; 1 - chi2.cdf(chi2_stat, df=9999). A p-value below 0.01 or above 0.99 indicates a serious anomaly.
This test is not definitive on its own. A single failed test can happen by chance if you run many different samples. But a casino that consistently fails on several independent 10,000-roll sets should be examined further.
What to Check in the Casino’s Implementation
Before you blame the operator, verify that you are reading the result field correctly. Some games report the roll result as a number between 1 and 10,000, but others report the payout multiplier or the actual dice total (2 to 12) if it is a classic dice game. If you are testing a game with only 11 possible outcomes, the distribution is not uniform over 10,000 values. Adjust the number of categories accordingly.
Also check whether the game uses a hidden house edge reduction feature. Some dice games modify the range of possible outcomes to achieve a specific house edge. For instance, a 1.00% house edge game might map the last 100 values to a loss, independent of your chosen target. In that case, the outcome distribution is uniform only on the remaining 9,900 values. The chi-square test should then be applied to the truncated set.
For a comprehensive review of verified operators, see our casino reviews. The reviews list which operators provide full seed history and which require you to wait for the next round for seed disclosure.
Practical Steps for a Clean Test
- Choose a nonce range of exactly 10,000 consecutive rolls from a single session.
- Export the data and parse the outcome field for each roll.
- Verify the server seed hash for the seed that started that session.
- Count frequencies and compute the chi-square statistic.
- Compare the statistic against the expected range for 9,999 degrees of freedom.
- Repeat the test on a second independent sample if the first one fails.
If you find a persistent anomaly, document the exact seeds, nonces, and hashes. A reputable operator will investigate if you provide a clear report. Before engaging support, also check the house rules: some operators state that the random number generator is continuously tested and may refuse to provide manual audits. That response, while annoying, is not evidence of fraud.
Limitations of the Distribution Test
The 10,000-roll sample can detect gross manipulation, such as a generator that only uses 5,000 distinct values or a biased mapping. It cannot detect a sophisticated algorithm that passes distribution tests while still tracking individual bets. For that, you need to verify each roll independently using the seed and nonce. The distribution test is a complement to seed-level verification, not a replacement.
Another limitation is sample size. A truly random sequence can produce a chi-square statistic up to 10,300 with moderate probability. If you run the test on 20 different games, you might see one p-value below 0.02 by chance alone. Do not claim fraud based on one marginal result. Look for patterns across multiple samples and multiple games.
Managing the size of your test bankroll is also important. Collecting 10,000 rolls with real funds can carry variance. You should only run such a test with a bankroll you can afford to lose. See our bankroll management guide for setting appropriate bet sizes during testing. The minimum bet times 10,000 is often the cheapest way to gather data, but even that adds up.
Stay current with known issues and operator responses in our news section, where we report on fairness audits and changes to verification methods.
FAQ
Can I run the 10,000-roll test without a server seed?
No. The distribution test only tells you that the observed outcomes are consistent with a uniform random process. It does not prove that the casino could not have chosen favorable seeds after the fact. You must verify at least the revealed server seed hash and preferably re-derive the roll results from the seed and nonce for a subset of bets.
What is the ideal chi-square value for a 10,000-roll dice test?
For a game with 10,000 possible outcomes, the expected chi-square statistic is approximately 9,999. Values between 9,600 and 10,400 are completely normal. Values below 9,200 or above 10,800 are unlikely and you should investigate the game logic or your data collection method.
Does a passing distribution test prove the casino is fair?
No. A single distribution test provides evidence that the aggregate results are uniform, but a malicious operator could intersperse a biased sequence for certain accounts or nonce ranges. True fairness requires the ability to verify every roll from published seeds and hashes. The distribution test is one useful check, not the final proof.