Volatility Ratings Are Marketing. Here Is How to Measure Them Yourself

the author
ProvablySmart Research Desk
date post
Aug 28, 2026
Share


In 2026, the term “volatility” on a casino game page is a label, not a measurement. No universal scale exists, and the same game can be described as “medium” on one site and “high” on another. Worse, the label often appears before the return-to-player (RTP) figure, suggesting it was written by a marketing department rather than derived from the game’s math model. If you want to know how a game actually behaves, you can measure volatility yourself using publicly available rules, seeds, and verifiable spin data. This article shows you how.
Why Published Volatility Ratings Fail Verification

Most casino sites assign volatility using one of three generic buckets: low, medium, or high. Those buckets are not tied to a published formula. Some providers define high volatility as a high proportion of stake returned in the top 2% of outcomes; others use hit frequency or the size of the biggest win on the paytable. When both definitions produce the same label, comparing two games by label is meaningless.
You can verify this quickly. Open any slot’s help section and check whether the game states a numerical variance or standard deviation. It almost never does. Instead, you get a static sentence like “High volatility: big wins come rarely”. That is not a mathematical claim. A similarly vague warning appears on games with vastly different paytable structures, max win caps, and bonus frequencies.
RTP alone cannot fix this. Two games can both have a 96.2% RTP, yet one pays small frequent returns while the other relies on a few 5,000x wins. The risk you assume during a session—drawdown, time until a meaningful payout, and the probability of losing your entire bankroll before hitting a high-order payline—is a function of the distribution of returns, not the arithmetic mean.
What Volatility Actually Is (and What It Isn’t)
How Does This Compare to 0% House Edge Protocols?
Audited 100% RTP
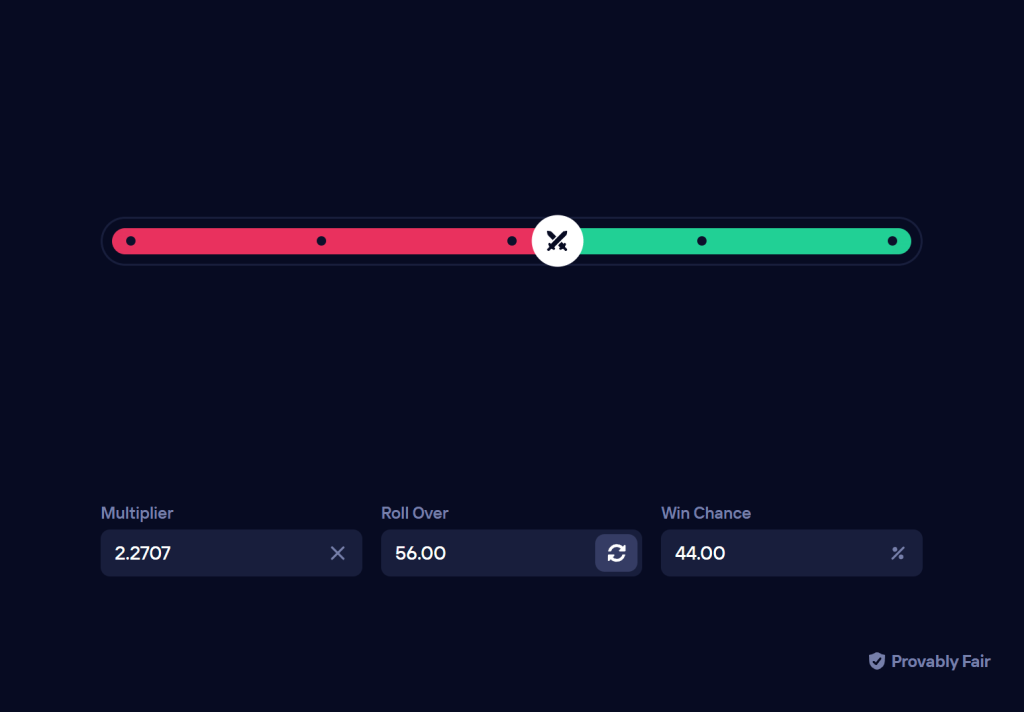
Instead of standard 1.00% to 4.00% casino house margins, compare with mathematically verified 100% RTP Originals (0.00% House Edge) on Duel Casino:

Volatility, in a gambling context, is the dispersion of possible outcome values around the expected return. It is normally quantified as variance or standard deviation per spin. For a discrete paytable with outcomes xi and probabilities pi, the expected return per spin is:
μ = Σ(pi × xi)
Variance is:
σ² = Σ(pi × (xi − μ)²)
Standard deviation σ is the square root of variance. The coefficient of variation, σ / μ, is a useful per-spin risk index because it normalizes dispersion to expected return. A game with μ = 0.96 and σ = 7.0 has a CV of 7.29; a game with μ = 0.96 and σ = 3.0 has a CV of 3.13. The first game will feel dramatically more volatile, even though both have the same RTP.
Two common confusions deserve rejection:
- Hit frequency is not volatility. A game can pay on 40% of spins but only return small amounts, while a “low hit frequency” game can be low variance if the rare wins are only moderately large.
- Maximum win is not volatility. A 10,000x cap with infinitesimal probability contributes little to variance. The shape of the entire distribution matters more than any single extreme outcome.
Step-by-Step: Measure It Yourself
There are two practical routes to estimating volatility. The first works when the game exposes its paytable and probability weights. The second works when the game is provably fair and you can replay past spins. Both are doable with a spreadsheet and a few hours of careful work.
Method 1: Reconstruct the Paytable Distribution
Start with the game’s help screen or paytable. List every distinct winning outcome, including base-game symbol combinations, scatter wins, and bonus triggers. For each outcome, record the win multiple (in units of stake) and, if available, the probability weight. If the provider publishes reel strip data or the exact weighting per symbol, convert those weights into outcome probabilities. Then calculate μ, σ, and CV as shown above.
This method fails when the provider hides the probability weights for bonus features, free spins, or progressive multipliers. Many games publish only the base-game paytable and an RTP figure. You cannot solve for the feature distribution from two aggregate numbers. In that case, treat the paytable reconstruction as an upper bound on your confidence, not a complete model.
Method 2: Sample Provably Fair Spins
For in-house casino games that support provable fairness, the casino publishes the server seed, your client seed, and a nonce. You can verify that the game hash matches the seed used, then simulate the same game logic from the seed to generate an arbitrary number of past spins. This gives you a transparent, replayable sample.
If you can generate 100,000 or one million spins, compute the following metrics from the raw outcomes:
| Metric | Calculation | What It Tells You |
|---|---|---|
| Mean return per spin | Average of all spin outcomes | Compare to published RTP; deviations indicate sample size or seed bias |
| Standard deviation | Square root of the average squared deviation from the mean | Per-spin dispersion; higher means more variability |
| Coefficient of variation | Standard deviation ÷ mean return | Volatility normalized by expected value; best comparison metric |
| 5th percentile of 100-spin sessions | Sort 100-spin totals, read the value below which 5% of sessions fall | Worst realistic short-session loss |
| Largest drawdown | Maximum peak-to-trough bankroll decline in a simulated session | Risk to bankroll management plan |
No table of summary stats can give you perfect certainty; you are estimating a distribution, not discovering a fixed constant. But unlike a marketing label, these numbers are checkable: any user with the same seeds and game logic can reproduce your sample.
What to Compare Across Games
Using the metrics above, compare games by coefficient of variation first, then by the distribution of 100-spin and 1,000-spin session returns. A game with a higher CV requires a larger bankroll to survive the same probability of ruin. If you are building a bankroll plan, you should care about the 5th percentile of a 100-spin session, not the marketing tag.
For games without provable fairness, the only honest comparison is between the published RTP and the game’s own stated hit frequency. If the casino does not disclose hit frequency, the volatility label is unverifiable by definition, and you should treat it as advertising. Cross-checking independent tracking sites can help identify inconsistent claims, but those sites often rely on the same self-reported data from providers. Your own recorded play history, if large enough, is a better baseline than any third-party label.
Limits of Self-Measurement
Empirical measurement has hard boundaries. First, if the game is a black box with no exposed seeds or replay function, you cannot verify the casino’s stated RTP, let alone its variance. Even a large personal play sample of a few thousand spins is too small to estimate standard deviation with useful precision because the distribution is heavily right-skewed. You might record one 800x win that dominates the sample, or you might miss the 1-in-250,000 feature entirely. The central limit theorem helps only when sample size is large relative to the variance of the paytable, which is rarely true for real slot play.
Second, in-house games that are not provably fair should be treated as unverifiable, regardless of what the casino says about volatility. This does not imply fraud; it implies that you cannot independently replicate the outcomes. For a provider to be auditable, you need at minimum the seed-generation script, the spin derivation algorithm, and a published hash that commits to the seed before bets are placed. If those are missing, no measured volatility estimate is trustworthy.
Third, be careful about aggregator platforms that display “high volatility” tags generated from community play data. Those tags are based on self-reported sessions, which suffer from selection bias: players are more likely to report extreme wins and extreme losses. That produces a distribution that is wider than the true one.
How Casinos Can Make This Easier
Some crypto casinos already publish verifiable game math for their in-house titles. If you want to evaluate an operator, check whether its casino review page includes links to audited RTP tables, seed hashes, and a spin verifier for every game. A casino that cannot tell you the exact paytable probabilities of its own slots is not giving you data; it is giving you a slogan.
As of 2026, the most useful thing an operator can do is publish the full outcome distribution for each in-house game: the paytable, the probability weights per outcome, and a function that maps a seed and nonce to a result. With that information, volatility stops being a label and becomes a calculation. Nothing in this article requires proprietary tools. A spreadsheet, a publicly documented game algorithm, and a commitment to record your own session data are enough to replace every “low/medium/high” tag with a number you can defend.
FAQ
What is the simplest volatility metric I can compute?
If you have the paytable and its probabilities, the coefficient of variation (standard deviation divided by expected return per spin) is the simplest and most comparable metric. If you do not have probabilities, the empirical standard deviation of a large sample of verified spins is the next best option.
Why do two “high volatility” slots play so differently?
Because the label is not standardized. One high-volatility game might have a moderate variance but a rare top prize; another might have frequent small wins and very rare massive wins. Both can be called high volatility while having different drawdown profiles and different bankroll requirements.
Can RTP and average payout tell me enough about risk?
No. RTP is an arithmetic mean over an infinite number of spins. It does not tell you how often you will win, how large the losing streaks can be, or what share of the return comes from rare top outcomes. Volatility measurement requires the full distribution of outcomes, not just its average.